Litecoin and Tron Chart Analysis for June 30, 2023

As Litecoin sits in anticipation of its halving, Tron keeps up its bullish momentum that kicked off in the fall of 2022. Here's a look at the technical analysis of the altcoins Litecoin (LTC) and Tron (TRX).
Litecoin
The crypto world is buzzing in anticipation of the Litecoin halving event slated for July 24. This upcoming milestone seems to be buoying Litecoin's performance. The coin has been on an uptrend for a full year now, and just last night, it saw a sharp 13% increase. At present, the significant resistance point is the psychological level of $100, with subsequent sellers' orders amassed around the $110 mark.
Support is coming up closely at the $86-$90 bracket. Further down, we can expect to find support at $81.6 and within the $76 to $79.4 range.
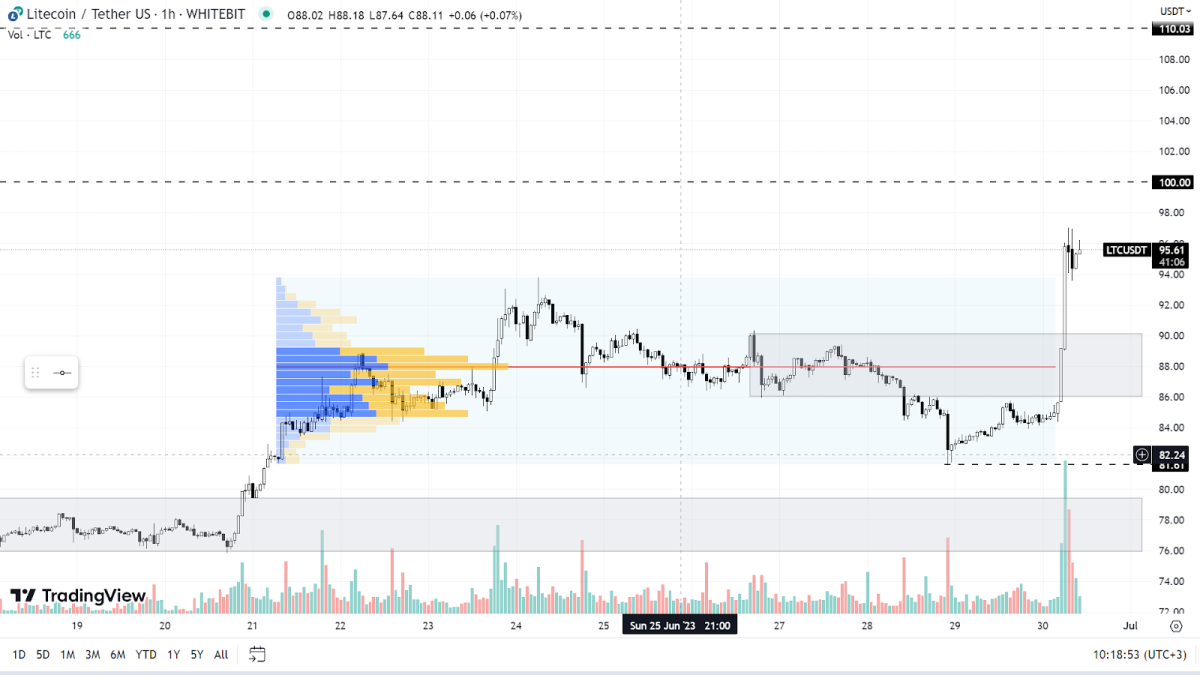
LTC chart on the H1 timeframe
Tron (TRX)
The trend on the Tron (TRX) chart remains positive as well. Recently, the asset underwent a slight correction, dropping to the support zone of $0.064-$0.068. If the correction intensifies, the next range targeted by buyers would be the $0.055-$0.059 area.
On the other hand, sellers have positioned their orders at the $0.075 level and the local peak of $0.085. If these levels are surpassed, it's feasible for buyers to propel the price up to $0.093 and even challenge the psychological level at $0.1.

TRX chart on the H4 timeframe
Bitcoin's chart situation is consistent with yesterday's analysis. The leading cryptocurrency is still moving within the range, between the support level of $29,800 and the resistance level of $31,400, preserving an upward trajectory.
Check out Gagarin News for the latest cryptocurrency rates and chart analysis.
Check out Gagarin News for the latest cryptocurrency rates and chart analysis.
Disclaimer
Please note that the analysis provided above should not be considered a trading recommendation. These are solely the opinions of the Gagarin News editorial board regarding the market situation. Before opening any deals, we strongly advise conducting your own research and analysis.
Abbreviations
TF (Timeframe) — a chronological period equal to the time it takes to form one Japanese candle on the chart.
Horizontal channel (flat, sideways, range) — the movement of price between support and resistance levels, without going beyond the given range.
К — simplified designation of one thousand dollars of the asset price (for example, 23.4K - $23,400).
Gray range on the chart — a support zone.
Red range on the chart — a resistance zone.
Correlation — the tendency of prices of different cryptocurrencies to move in sync, often influenced by the dominance of one of the assets.
Initial materials
This analysis was informed by the following educational materials and articles from Gagarin News:


